Grafana and Prometheus Access
Verify access to Prometheus and Grafana by running port forwarding commands in its own separate terminal, instructions also displayed after ‘terraform apply’ command completes its run.
kubectl port-forward svc/kube-prometheus-stackr-prometheus 9090:9090 --namespace monitoring
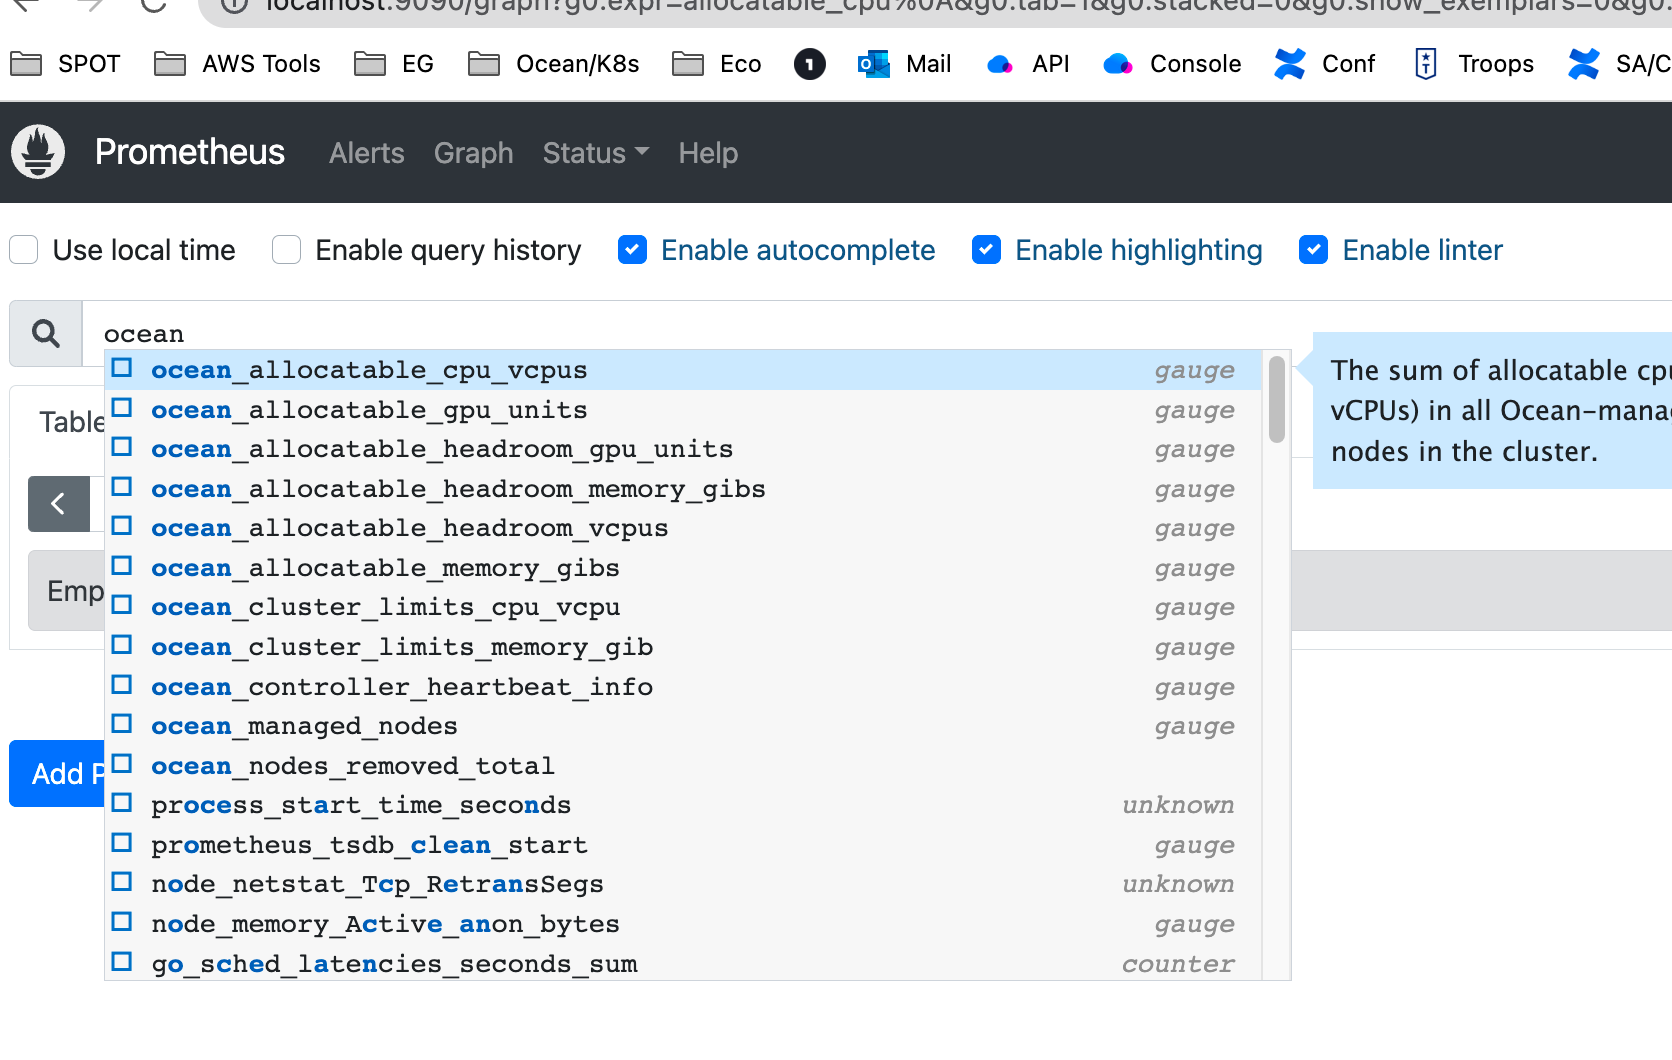
- Access at http://localhost:9090
- Verify that you can see spot metrics by typing “ocean” in graph search bar as per below.
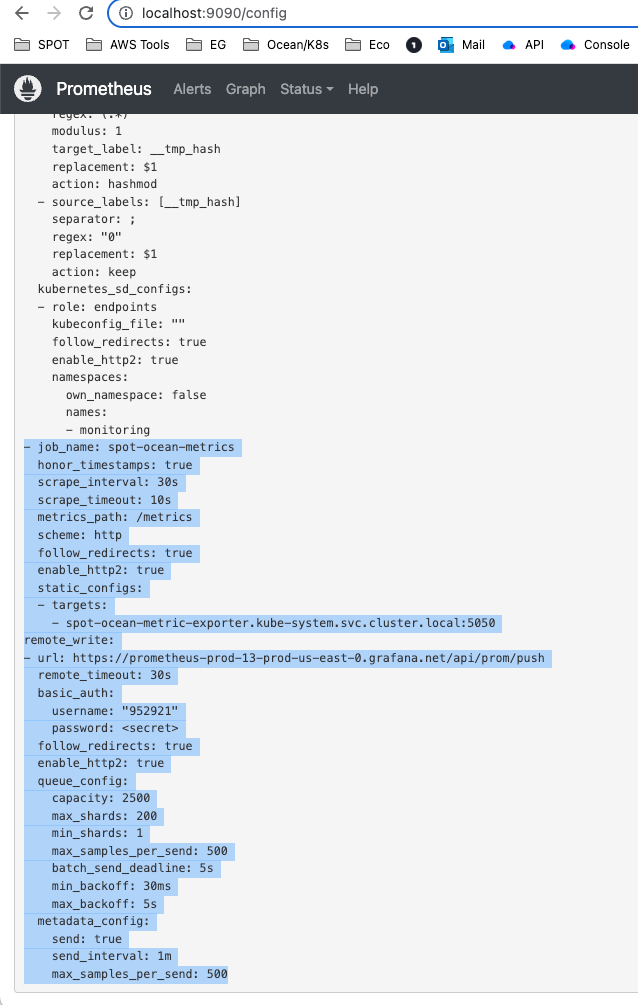
IF OCEAN METRICS ARE NOT VISIBLE PLEASE VERIFY by clicking on Status, Config and making sure that job name propagated correct at the very bottom of the config file as per below:
kubectl port-forward svc/kube-prometheus-stackr-grafana 3000:80 --namespace monitoring
- Default Grafana via prometheus-stack credentials:
Access
-
user: admin
-
pass: prom-operator
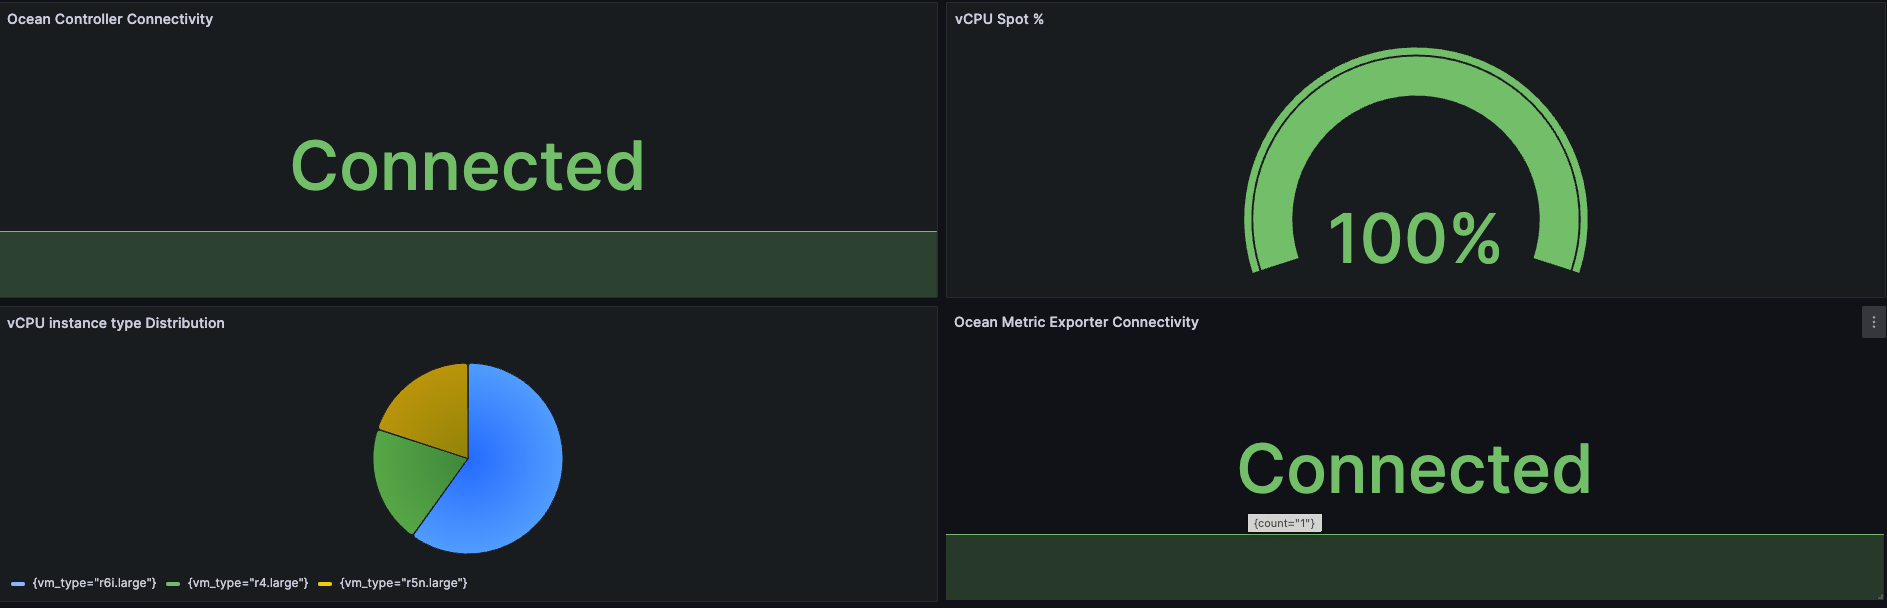
Import Spot Metrics Dashboard 16475 via Spot Ocean | Grafana Labs
-
set datasource to prometheus.
-
if all successful you should see a connected dashboard as per below.
REFERENCE LINKS
- AWS EKS
- OCEAN Controller Terraform Registry
- OCEAN AWS Terraform Registry
- OCEAN METRICS: Terraform Registry
- Helm Artifacts (helm is consumed via helm_release module: Terraform Registry
- Kube-Prometheus-Stack ( included Grafana ): kube-prometheus-stack 46.8.0 · prometheus/prometheus-community
Extra References and Useful Links
EKS creations observed time frame is about 9-13 minutes, the rest should be around 5-10 minutes on top of that.
KNOWN GOTCHAS
- DO NOT spin up Node-Group with 0 nodes.
- Currently you will lose local Prometheus and Grafana historical data at node/pod cycling, however Cloud Grafana will keep some data based on your account level, even free account still will store some historical.
- This EKS cluster configuration is not configured for PVC at the moment.
- pod/kube-prometheus-stackr-prometheus-node-exporter is placed on every node
If Upgrading Kubernetes Version you might want to remove Prometheus stack, upgrade, then re-install.