Elastigroup UI Overview
When the console opens up, it should position you at the Overview Dashboard. This dashboard will give you insights & recommendations on optimizing all of your connected cloud accounts. For today’s workshop, we will focus on Elastigroup. Let’s take a minute to get familiar with the UI.
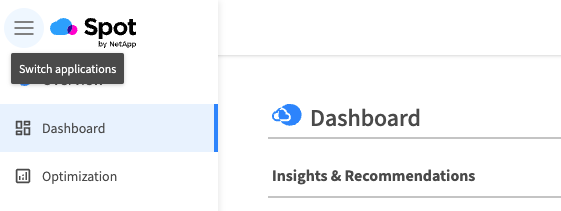
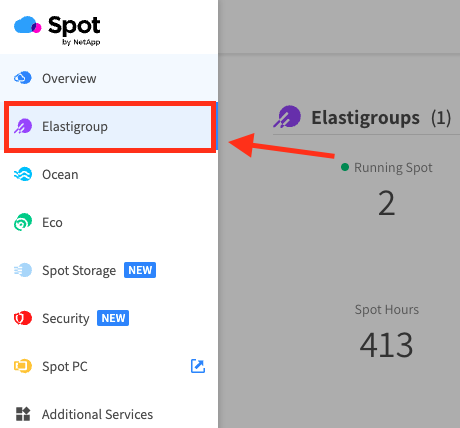
Click on the three vertical bars in the top left of the platform to switch applications and click on Elastigroup.
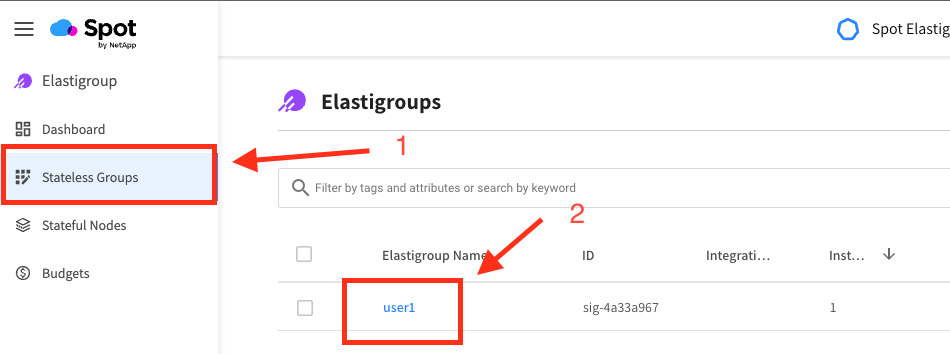
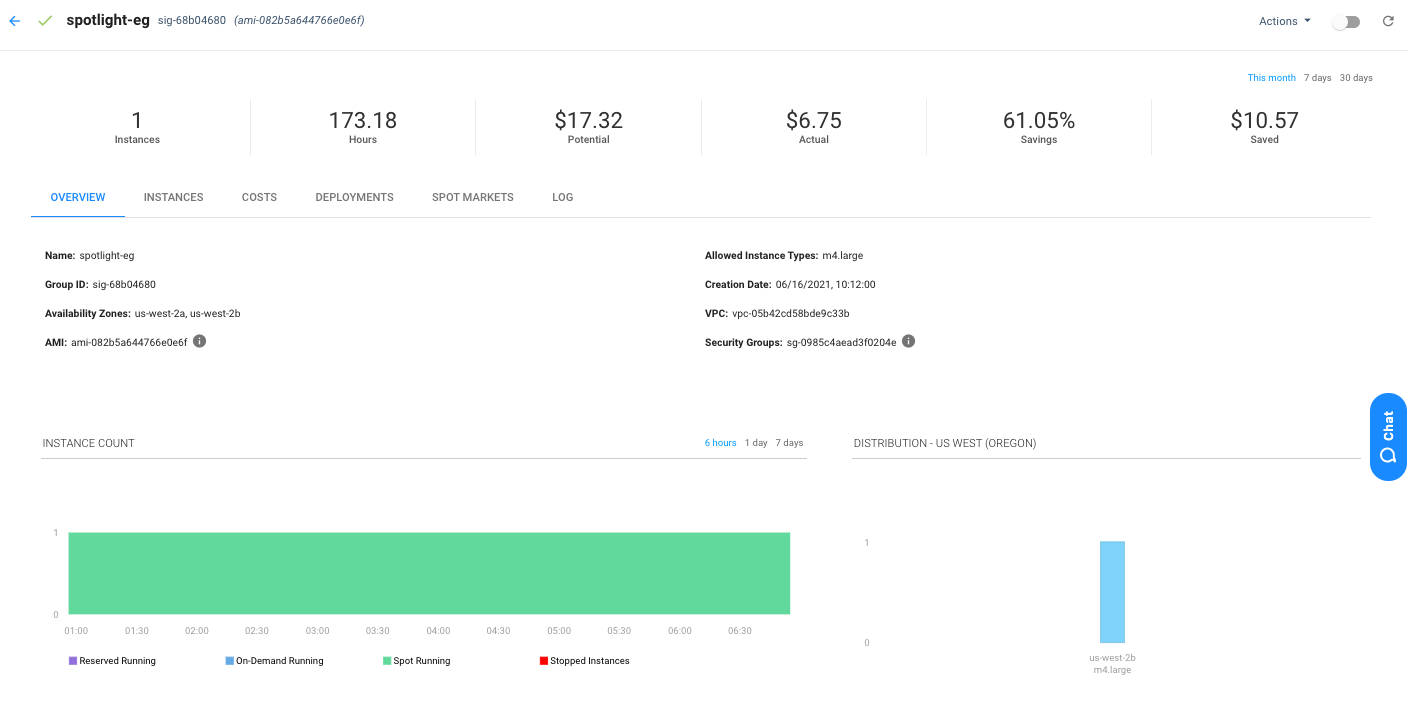
Click the only Elastigroup listed (i.e. user1). This overview tab will present you with an overview of an individual Elastigroup, utilization information, cost savings and visuals of running instance information.
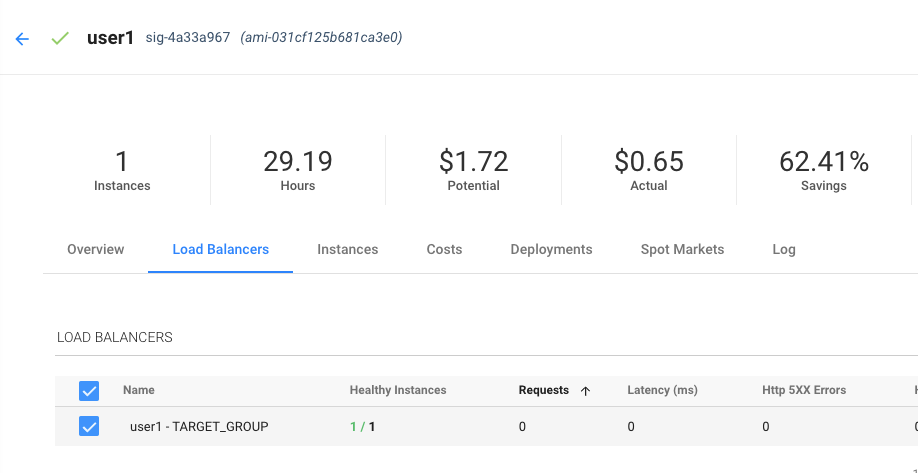
Click Load Balancers Tab. In this example, Elastigroup is integrating with an application load balancer. Elastigroup is responsible for registering all the instances to the load balancer and monitoring the health. Elastigroup will also present an overview of the ALB & Elastigroup metrics.
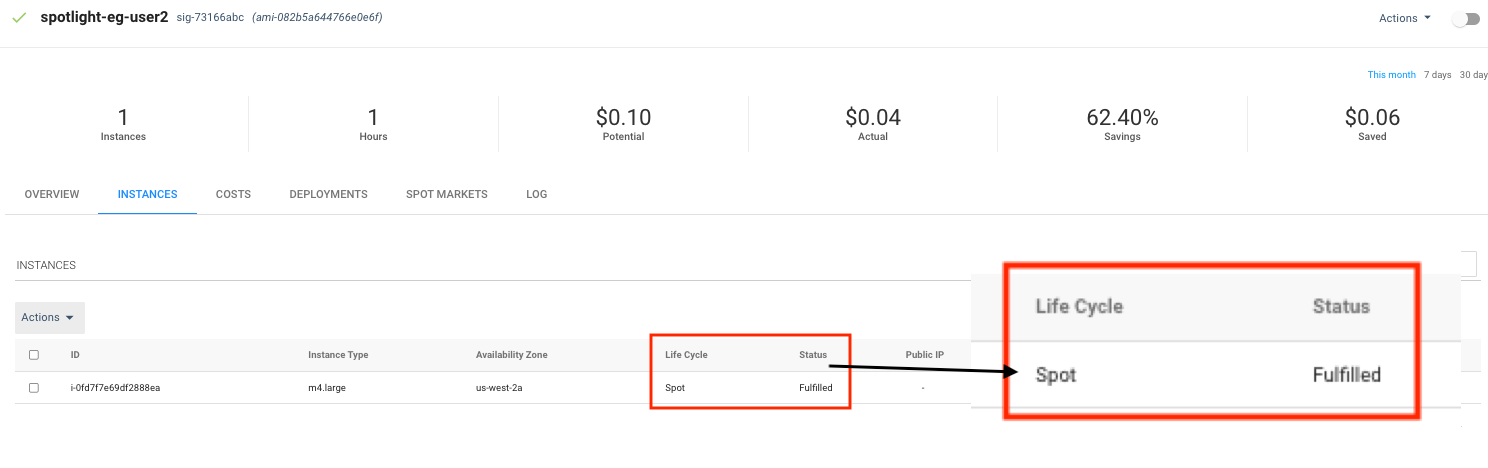
Click Instances Tab. This will show you a detailed list of the currently running instances within a group.
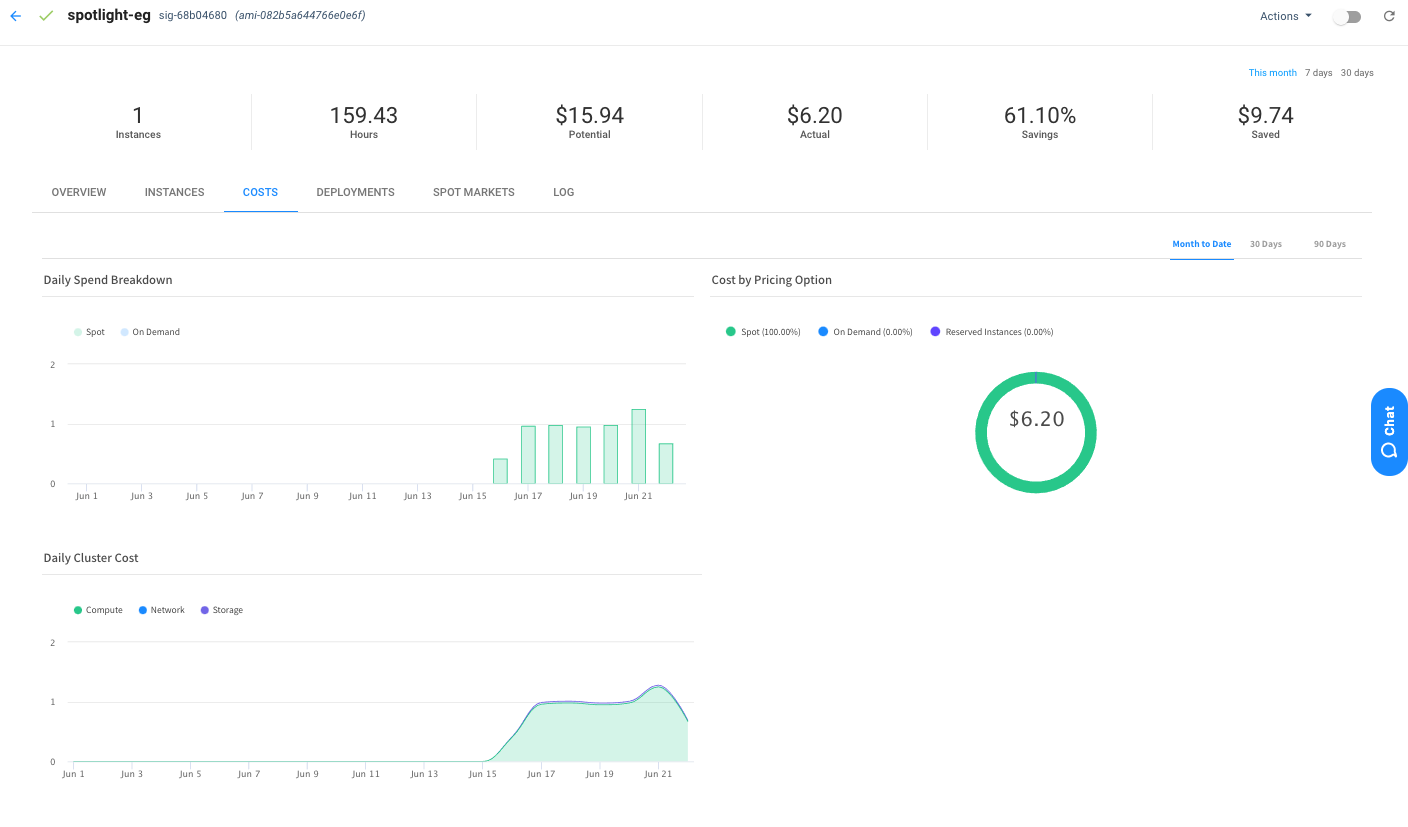
Click Costs Tab - Elastigroup will provide an overview of the group costs with data for daily spend, pricing lifecycle, network and storage costs.
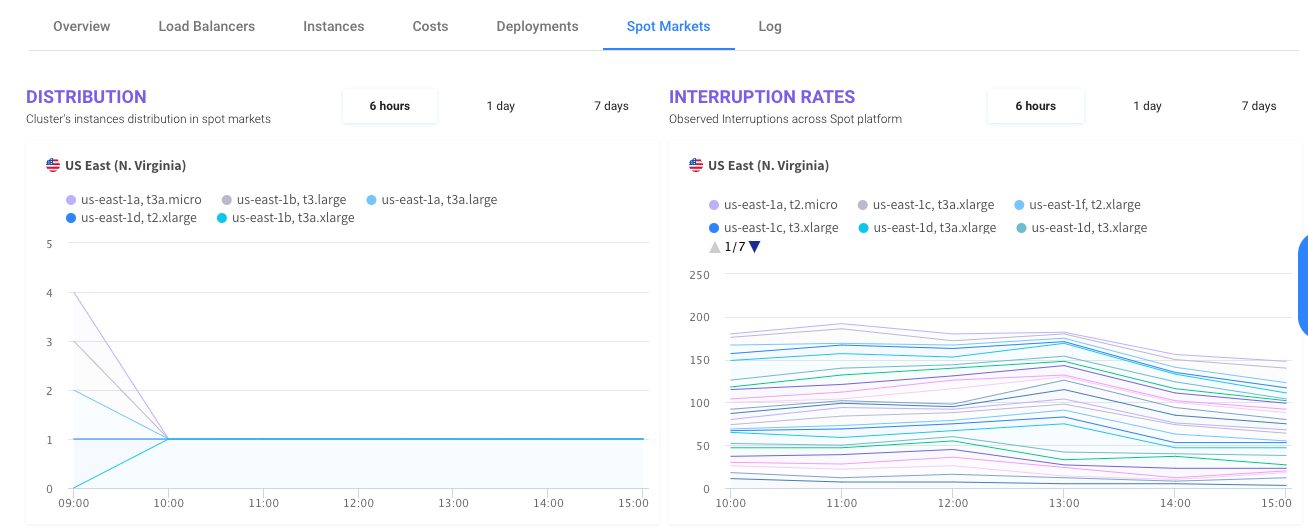
Click Spot Markets - Elastigroup will provide an overview of the current distribution of Spot markets (instance types + availability zone) and insight into the observed interruption rates across the Spot platform. All of this data is used to launch instances into the best possible spot markets for our customers.
That’s all for now, Let’s jump into our first lab